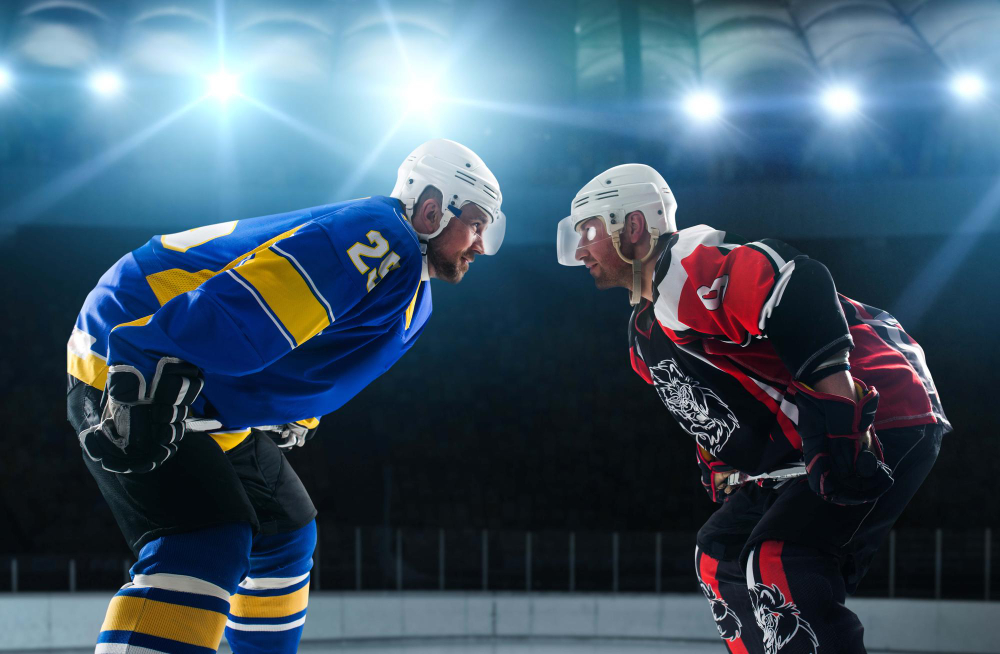
Hockey rankings are everywhere. On television, in your feed, in every group chat during a losing streak. But the useful question about Division I hockey teams is rarely who sits at No. 1. It is why they sit there, which system put them there, and what that list was built to measure.
That matters more than it used to, because the system the NCAA uses to pick its tournament field changed in 2025-26.
The field: 64 programs
Division I is the top tier of NCAA men’s ice hockey, and it is small. Sixty three teams played in 2025-26, across six conferences plus a group of independents. One program shut down after that season, and one is being added in each of 2026-27 and 2027-28. You will see the number given as 64 in places, usually because a list counts a program before its first season. Across all three NCAA divisions, 138 schools sponsor men’s hockey.
For 2026-27 the alignment looks like this:
- ECAC Hockey (12): the Ivies plus Clarkson, Colgate, Quinnipiac, RPI, St. Lawrence and Union
- Hockey East (11): the Boston bloc plus Maine, UMass, UMass Lowell, New Hampshire, Providence, UConn and Vermont
- NCHC (10): Denver, North Dakota, Western Michigan, Minnesota Duluth, St. Cloud State, Omaha, Colorado College, Miami, St. Thomas and Arizona State
- Atlantic Hockey America (9): Air Force, Army, Bentley, Canisius, Holy Cross, Niagara, RIT, Robert Morris and Sacred Heart
- CCHA (8): Augustana, Bemidji State, Bowling Green, Ferris State, Lake Superior State, Michigan Tech, Minnesota State and Northern Michigan
- Big Ten (7): Michigan, Michigan State, Minnesota, Notre Dame, Ohio State, Penn State and Wisconsin
- Independents: both Alaska schools, Lindenwood, LIU, Stonehill and Tennessee State, which began play in 2026
The count moves. Tennessee State is new, Maryville arrives in 2027, and programs have been dropped and revived within the last five years. On the women’s side, 45 schools compete at what functions as the Division I level.
Two structural facts about that list matter more than they look. Nineteen of the schools that played in 2025-26 are Division II or Division III athletic programs that play up to Division I in hockey alone. Only 16 are in the Football Bowl Subdivision, and seven of those are in the Big Ten. This is not a sport housed inside big football departments. It mostly lives somewhere else.
The competitive consequence is a short schedule and a small pool, which means one bad weekend moves a team further than it would in a sport with 130 programs. Sixteen teams reach the NCAA tournament. Six get in by winning their conference tournament. The other ten are chosen at large.
Who is actually on top
Denver won the 2026 national championship, beating Wisconsin 2 to 1 at T Mobile Arena in Las Vegas on April 11 after trailing into the third period. It was the program’s 11th title, more than any other Division I program, and its third in five years. Michigan is next on the all time list with nine, then North Dakota with eight and Wisconsin with six.
Freshman goaltender Johnny Hicks was named Most Outstanding Player after stopping 78 of 82 shots across the Frozen Four. He finished 16 wins, no losses and a tie, with a .957 save percentage that set an NCAA single season record. Denver ended 29 wins, 11 losses and 3 ties, and gave the NCHC its eighth national champion in ten seasons.
Michigan and North Dakota filled out the Frozen Four. Michigan entered as the No. 1 overall seed, with North Dakota, Michigan State and Western Michigan as the other top seeds. Max Plante of Minnesota Duluth won the Hobey Baker Award as the sport’s best player, with 25 goals and 52 points.
One result says more about the field than any poll did. For the first time since 1981, none of the four Beanpot programs, Boston College, Boston University, Northeastern and Harvard, reached the tournament at all.
The women’s game
Women’s Division I hockey is formally the NCAA’s National Collegiate division, and 45 teams competed in it in 2025-26 across five conferences:
- ECAC Hockey (12), the only Division I hockey conference in which every member fields both a men’s and a women’s team
- Hockey East (10), all New England programs
- NEWHA (8), the newest conference, recognized by the NCAA in 2019 and awarded its first automatic bid in 2021-22
- WCHA (8), now a women’s only league after seven of its men’s members left to revive the CCHA
- Atlantic Hockey America (7), formed in 2024 by merging the men’s Atlantic Hockey Association with the women’s College Hockey America
The tournament takes 11 teams rather than 16, and the Patty Kazmaier Memorial Award goes to the sport’s best player.
Wisconsin won the 2026 title, beating Ohio State for the program’s ninth championship. Goaltender Ava McNaughton was named Most Outstanding Player. Penn State reached its first Frozen Four. The WCHA’s grip on this sport is close to total: apart from three championships won by Clarkson, every national title in women’s college hockey has gone to a WCHA team. Delaware is the newest program, having started National Collegiate play in 2025-26.
The ranking that decides the tournament: NPI
This is the part most ranking explainers have not caught up with.
For years the NCAA selected its hockey field using the PairWise, which compared every team against every other team on head to head results, common opponents and RPI. As of 2025-26, PairWise is gone. The NCAA now uses the NPI, or NCAA Percentage Index, as the sole selection and seeding metric in Division I men’s hockey. Women’s hockey moved to it earlier.
NPI is simpler than what it replaced. In its default form a team’s rating is 25 percent winning percentage and 75 percent strength of schedule, where strength of schedule is the average NPI of the opponents played. Because every opponent’s rating depends on their own opponents, the whole thing is solved iteratively across the division.
Two quirks explain results that otherwise look broken:
- Quality win bonus. Beating a strong opponent adds a bonus on top of the base calculation.
- Discarded games. A win that would lower a team’s rating, meaning a win over a very weak opponent, can be thrown out. So can a loss that would raise it. Public NPI trackers mark these with asterisks.
That second rule is why a good team can beat a bad team and watch nothing happen. The game was discarded.
Sport committees can adjust the weights, so default NPI and the version in use are not always identical. If you follow one ranking all season, follow this one. It is the only one with a trophy attached.
A worked example: the 2026 scoring leaders
Raw offensive numbers are the most cited and least predictive stat in college hockey. The 2026 season makes the case cleanly. Here is where teams stood in scoring offense through the regionals:
| Rank | Team | Goals per game |
| 1 | Michigan | 4.56 |
| 2 | Quinnipiac | 4.05 |
| 3 | North Dakota | 3.85 |
| 4 | Union | 3.78 |
| 5 | Wisconsin | 3.76 |
| 8 | Denver | 3.61 |
| 11 | Lindenwood | 3.50 |
Michigan scored 178 goals in 39 games, nearly half a goal per game clear of anyone else, and reached the Frozen Four before losing. Denver ranked eighth and won the national title. Lindenwood ranked 11th and never came close to the tournament, because an independent schedule gives you almost nothing under a metric that is three quarters strength of schedule.
Three teams from that top five did reach the Frozen Four, so scoring is not meaningless. It is conditioned on who you played and on whether your goaltender holds up in a single elimination game. Denver’s championship was won by a freshman with a .957 save percentage, not by the eighth best offense in the country.
What actually drives the numbers
Strength of schedule. Under NPI it is three quarters of the calculation. A 22 and 10 record built against the bottom of the division can rate below an 18 and 14 record built against the top. That is not a flaw. It is the design.
Goal differential. Over a full season it predicts future results better than win loss record, because it captures how much of a record came from one goal luck.
Goaltending. In a sport this low scoring, one goaltender distorts everything.
Special teams. Power play and penalty kill swings move teams faster than anything else here, because they compound. A struggling penalty kill loses games a team was otherwise winning.
Sample size. A Division I season runs roughly 34 to 40 games, a third of an NHL schedule. Randomness survives longer in a short season, which is why college rankings look wilder than professional ones.
Roster churn, now more than ever. Players from the Canadian Hockey League were treated as professionals and ruled ineligible for decades. The NCAA reversed that position in 2024, and CHL players became eligible starting in 2025-26. The effect showed up immediately at the top of the sport: Penn State’s Gavin McKenna went first overall in the 2026 NHL Draft, only the sixth NCAA player ever taken No. 1. Rosters were already turning over faster than in professional hockey, and a new talent pipeline on top of that means preseason rankings and last year’s results carry less weight than they used to.
A tier framework that survives the season
Rankings churn weekly. Tiers hold up better.
Tier 1. Championship caliber. Forward depth, a goaltender who can steal a series, special teams that do not leak. Denver, Michigan and North Dakota lived here in 2026.
Tier 2. Dangerous in a short series, usually on one elite unit, thinner when the schedule turns.
Tier 3. Bubble teams and upset threats. Strong at home, capable of beating anyone once, uneven on the road. NPI treats these teams least kindly, because their schedule rarely rescues an inconsistent record.
Tier 4. Young or rebuilding. Development years.
Why your team dropped after a win
In rough order of frequency:
- The opponent was weak enough that the win was discarded from the NPI calculation.
- A rival beat a stronger opponent the same weekend.
- Teams you already played lost, dragging your strength of schedule down retroactively.
- The margin was narrow and you are reading a predictive rating, not a resume one.
- A poll voter simply moved on.
The third reason is the one people miss. Under NPI, your rating changes based on games you did not play.
How to judge a rankings site
- Purpose. Selection, predictive, or poll. Stated up front, or not stated at all.
- Inputs. Are the weights published?
- Strength of schedule. Shown separately, or buried?
- Update pace. Daily, weekly, or whenever someone remembers?
- Stability. Does one game cause a ten spot swing? Then the model is fitting noise.
A site that cannot explain its method is entertainment. That is fine, as long as you know which one you are reading.
What none of these rankings measure
Here is what every system on this page has in common. NPI, KRACH, the USCHO poll, the tier framework above. All of them rank programs. None of them reach the players.
Go back to the structure of the field. Only 16 of these schools are in the Football Bowl Subdivision. Nineteen of them are Division II or Division III athletic departments that play up in hockey alone. The money in college athletics runs through football and men’s basketball, and the athlete payments now flowing out of athletic departments follow the same path. At most of these schools there is no such path, because there is no football program generating the money in the first place.
A goaltender at Bentley or a fourth line forward at Augustana is not getting a brand deal. No national company has a way to find him, and no athletic department has room in the budget.
Sixty three programs, rosters of roughly 26. That is more than 1,600 athletes playing the top level of a sport, and only a handful will ever see a dollar from any of it. Around 30 percent of NHL players came through college hockey. The rest of these rosters are playing for four years and a degree.
And Division I is the top of a pyramid. In late March, while the Division I regionals were being played, Hamilton beat Hobart 2 to 1 in overtime for the Division III title in Utica, ending a Hobart season that had run 28 games without a loss. Ninety one programs play Division III men’s hockey. Nobody is writing them checks either.
Their fans know exactly who they are. That is the whole idea behind RallyFuel.
How fan funding works. A fan picks an athlete and contributes directly. Ninety percent of that contribution reaches the athlete. It runs as a compliant NIL arrangement, so it does not put eligibility at risk. No brand has to notice first, no agency has to make a call, and nothing has to come out of an athletic department budget that is already spoken for.
Fuel a college hockey player →
Browse men’s rosters or women’s rosters
The takeaway
Rankings are instruments, not verdicts. For Division I hockey specifically, watch NPI for tournament position, a predictive rating like KRACH for real strength, and goal differential plus special teams for whether a change is signal or noise.
The 2026-27 season opens in October, and the Frozen Four heads to Capital One Arena in Washington, D.C., in April 2027. Denver will be defending.
Frequently asked questions
How many Division I hockey teams are there?
Sixty three teams played men’s Division I hockey in 2025-26, across six conferences and a handful of independents. One shut down after the season, and one program is being added in each of the next two seasons. The women’s game is covered separately below. Across all three divisions, 138 schools sponsor men’s hockey and 108 sponsor women’s.
You will find lower counts on some recruiting sites, often in the high 50s. Those lists tend to mix in women’s programs, club teams playing in the ACHA, and schools with no varsity hockey at all, while omitting most of the CCHA. If a list does not include Michigan Tech, Minnesota Duluth or Bemidji State, it is not a complete list.
What replaced the PairWise rankings?
The NPI, or NCAA Percentage Index, became the sole selection and seeding metric for Division I men’s hockey in 2025-26. It weights winning percentage at 25 percent and strength of schedule at 75 percent by default, adds a bonus for quality wins, and discards certain games that would distort a rating.
Who won the 2026 national championship?
Denver, beating Wisconsin 2 to 1 in Las Vegas on April 11, 2026. It was the program’s 11th title and its third in five seasons.
What is the difference between resume and predictive rankings?
Resume rankings, including NPI, measure what a team already earned through results and schedule. Predictive rankings such as KRACH estimate how strong a team actually is and who would win tomorrow. A team can rank well in one and poorly in the other, and neither is wrong.
Why did my team’s ranking drop after a win?
Usually because the win came against an opponent weak enough to be discarded under NPI, because a rival posted a better result, or because teams you played earlier lost and pulled your strength of schedule down.
Which stats matter most when judging a ranking?
Goal differential, strength of schedule and special teams efficiency, plus goaltending, which matters more in hockey than in almost any other team sport.
Can I build a credible ranking myself?
Yes, and it is a good way to understand the published ones. Weight goal differential at 40 percent, special teams at 25, strength of schedule at 25 and recent form at 10 into a quality score, then adjust each game for opponent strength and home ice. It will not match NPI, but it will be internally consistent, which is more than some public lists manage.
Sources: NCAA.com championship coverage and team statistics, College Hockey Inc., College Hockey News NPI ratings, USCHO, and Wikipedia’s list of NCAA Division I ice hockey programs.